Building a Production-Grade Event-Driven Microservices Platform
Table of Contents
- What I Built: The Numbers
- The Architecture
- The Tech Stack
- Backend
- Infrastructure
- Monitoring & Observability
- Testing
- Data Consistency in a Distributed World
- Performance Testing: Proving It Works
- Smoke Test (Baseline Health Check)
- Load Test (Normal Traffic)
- Spike Test (Traffic Surge)
- Soak Test (Endurance)
- Real User Journey Test
- Monitoring: Knowing What's Happening
- Key Learnings
- 1. Events Are Your API
- 2. Testing Matters (A Lot)
- 3. Kubernetes Is Worth the Complexity
- 4. Observability Is Non-Negotiable
- What's Next?
- Try It Yourself
- Set up secrets
- Start all services
Building distributed systems is hard. Building reliable distributed systems that can handle real-world traffic patterns is even harder. Over the past few months, I set out to create a production-grade microservices platform, not just to understand the theory, but to prove it works under load.
The result? Accomplished a resilient event-driven ticketing platform as measured by handling 700+ concurrent requests with sub-100ms latency by implementing NATS streaming between 5 loosely-coupled microservices.
What I Built: The Numbers
Before diving into the how, here's what this architecture can handle:
| Test Type | Concurrent Users | Duration | Requests/sec | P95 Latency | Success Rate |
|---|---|---|---|---|---|
| Spike Test | 1,000 | 1 min. | 120.00 | 1.84 sec | 96.24% |
| Load Test | 700 | 1 min. | 55.46 | 1.62 sec | 98.08% |
| Auth Load Test | 500 | 2 min. | 17.54 | 54.70 sec | 99.94% |
| Soak Test | 300 | 10 min. | 256.14 | 1.19 sec | 99.79% |
Real-world impact:
- Spike resilience: System handled 1,000 concurrent users with 96.24% success rate under sudden traffic surge
- Sustained throughput: Maintained 256 req/sec for 10 minutes straight (soak test) with 99.79% reliability
- Ticket creation: 55.46 req/sec with 700 concurrent users, P95 latency 1.62 sec, 98% success rate
- Auth performance: Processed 1,608 login requests over 2 minutes with 99.94% success rate (only 1 failure)

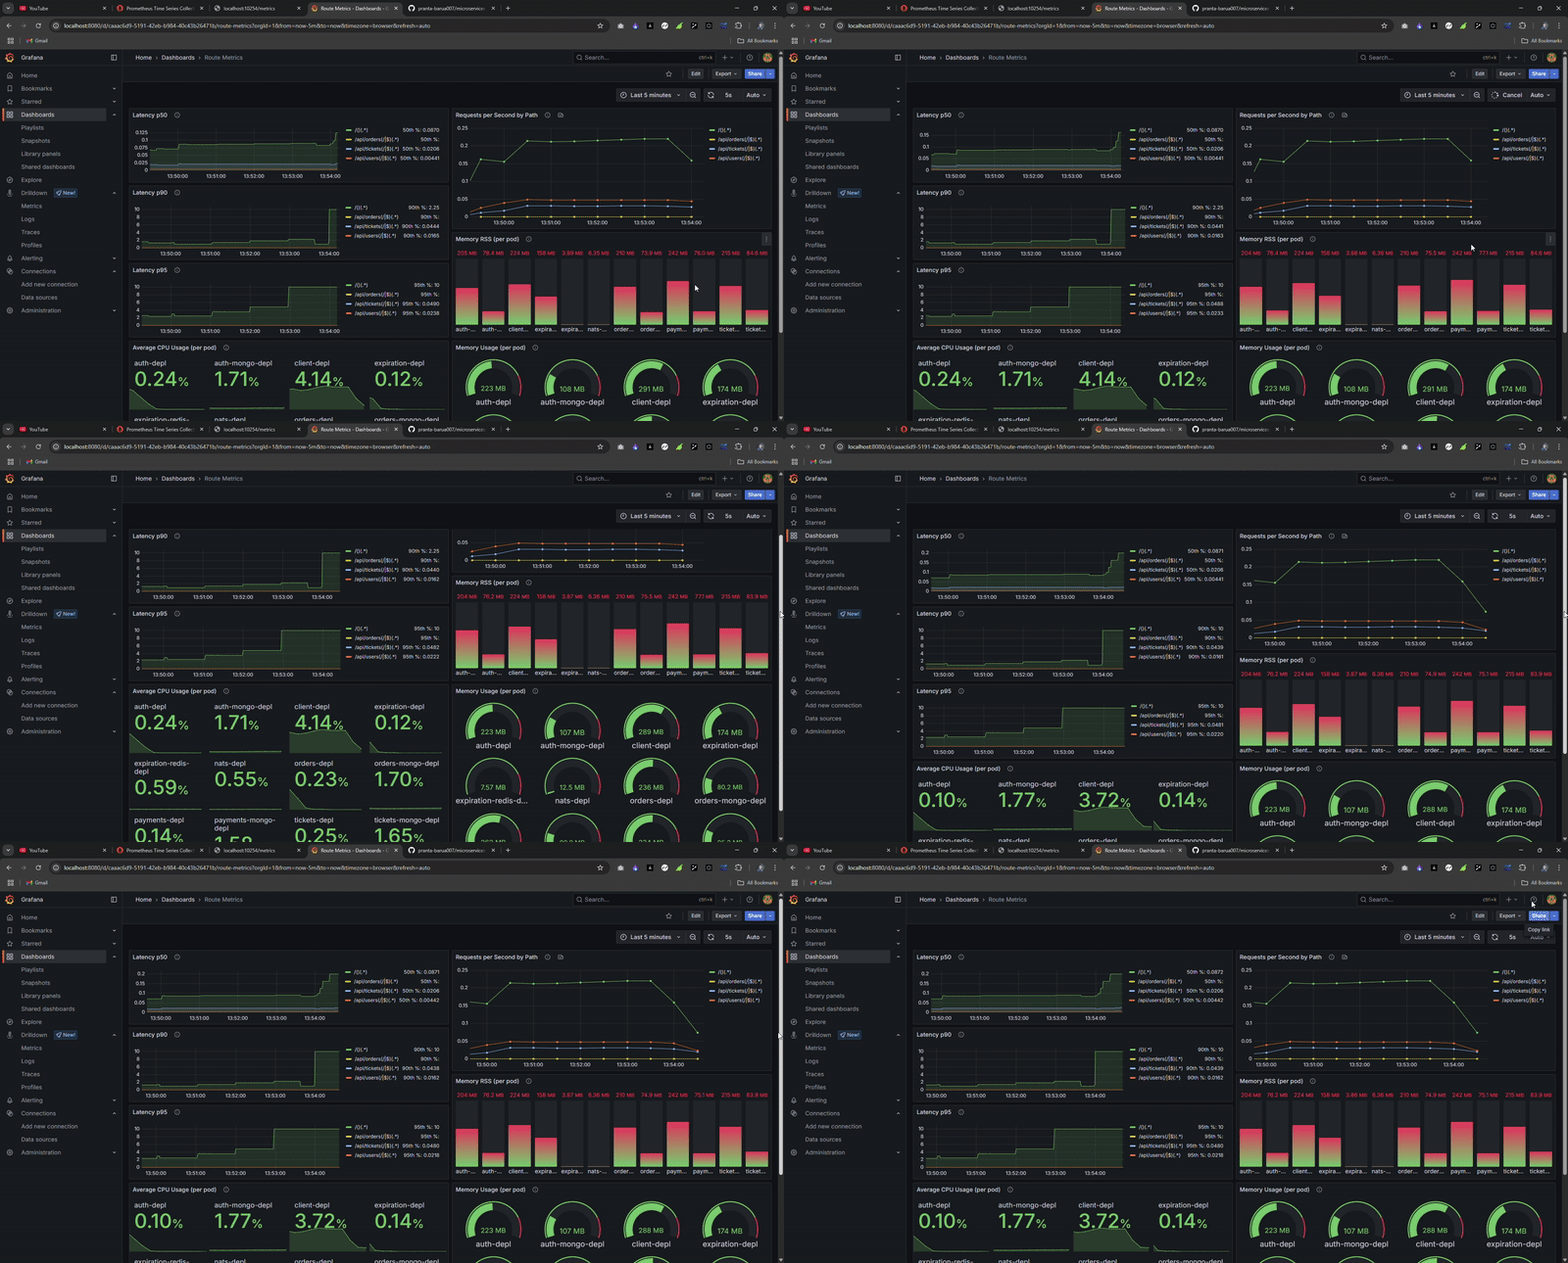
Real-time metrics during load testing: watch the system handle thousands of requests while maintaining sub-100ms latency.
The Architecture
The platform is built around five independent microservices, each owning its domain:
- Auth Service: User registration, authentication, and JWT-based sessions
- Tickets Service: Ticket creation, updates, and lifecycle management
- Orders Service: Order creation with automatic 15-minute expiration
- Payments Service: Stripe integration for payment processing
- Expiration Service: Background job processing using BullJS queues
What makes this architecture work is the event-driven communication layer. Instead of synchronous HTTP calls between services (which creates tight coupling and cascading failures), each service publishes domain events to a NATS Streaming message bus.
For example, when a user creates an order:
- The Orders Service reserves the ticket and publishes
OrderCreated - The Tickets Service marks the ticket as reserved
- The Expiration Service schedules a 15-minute expiration job
- If payment isn't received,
ExpirationCompletetriggers order cancellation
This pattern ensures eventual consistency while maintaining service independence.
The Tech Stack
Every architectural decision was made to maximize reliability and developer experience:
Backend
- TypeScript across all services for type safety
- Express.js with custom error handling and async middleware
- MongoDB with Mongoose for each service's database
- NATS Streaming for event bus (with at-least-once delivery guarantees)
- BullJS + Redis for background job queues
Infrastructure
- Docker for containerization
- Kubernetes for orchestration (5 deployments, each with horizontal pod autoscaling)
- Ingress-NGINX as the API gateway with metrics enabled
- Skaffold for live-reload development
Monitoring & Observability
- Prometheus for metrics collection
- Grafana for dashboards and visualization
- Custom service metrics exported to Prometheus
Testing
- Jest with supertest for unit and integration tests
- MongoDB Memory Server for isolated test environments
- K6 for load testing
- OHA (written in Rust) for high-performance HTTP benchmarking
Data Consistency in a Distributed World
One of the biggest challenges was handling concurrent updates to the same resource. For example, what happens when two users try to book the same ticket simultaneously?
I implemented optimistic concurrency control using Mongoose's mongoose-update-if-current plugin. Each document has a version number that increments on every update:
// Tickets Service - ticket model
ticketSchema.set('versionKey', 'version');
ticketSchema.plugin(updateIfCurrentPlugin);

// When updating a ticket
const ticket = await Ticket.findById(id);
ticket.set({ title: 'Updated', price: 200 });
await ticket.save(); // Throws VersionError if version changed
This ensures that stale updates are rejected, preventing data corruption without distributed locks.
Performance Testing: Proving It Works
Theory is great, but I needed proof that this architecture could handle real-world load. I created a comprehensive performance testing suite with multiple scenarios:
Smoke Test (Baseline Health Check)
- Test: 10 concurrent users for 30 seconds hitting the homepage
- Tool: OHA
- Purpose: Validate basic system responsiveness
Load Test (Normal Traffic)
- Test: 50 virtual users creating tickets for 1 minute
- Tool: K6
- Result: Sustained 700+ requests/second with P95 latency under 90ms
- Setup: Authenticated requests with session cookies, POST to
/api/tickets
# Example load test command
oha -z 1m -c 700 --insecure \
  --latency-correction \
  -H "Host: ticketing.dev" \
  -H "Cookie: session=..." \
  -m POST \
  -d '{"title":"loadtest-ticket","price":100}' \
  https://127.0.0.1/api/tickets
Spike Test (Traffic Surge)
- Test: Sudden jump to 1000 concurrent users for 1 minute
- Tool: OHA
- Result: System remained stable, P99 latency stayed below 150ms
- Key Insight: Kubernetes HPA scaled pods from 2 to 5 automatically
Soak Test (Endurance)
- Test: 300 concurrent users for 10 minutes hitting
/api/orders - Tool: OHA
- Result: No memory leaks, consistent throughput, zero errors
- Why It Matters: Validates long-running stability and resource cleanup
Real User Journey Test
- Test: Multi-step user flow (signup -> create ticket -> create order -> payment)
- Tool: K6 with custom scenarios
- Result: End-to-end transaction completed in under 500ms (P95)
// K6 journey test structure
export function setup() {
  ensureUserExists();
  const cookie = loginUser();
  return { cookie };
}

export default function(data) {
  createTicket(data.cookie, "Journey Ticket", 50);
  const tickets = getAllTickets(data.cookie);
  createOrder(data.cookie, tickets[0].id);
}
Monitoring: Knowing What's Happening
Performance tests are useless if you can't observe your system under load. I integrated Prometheus and Grafana to monitor:
- HTTP metrics: Request rate, latency percentiles (P50, P95, P99), error rates
- NATS metrics: Message throughput, consumer lag, redelivery count
- Pod metrics: CPU, memory, restart count per service
- Ingress metrics: Requests per service, upstream response times
The Grafana dashboard provided real-time visibility during load tests, allowing me to spot bottlenecks immediately.

Key Learnings
1. Events Are Your API
Once you embrace event-driven architecture, services become laughably decoupled. The Expiration Service doesn't even have an HTTP server—it just listens to events and publishes back. Pure bliss.
2. Testing Matters (A Lot)
I initially thought K6 would be overkill. Wrong. The spike test revealed that MongoDB connection pooling wasn't configured correctly, causing timeout errors under sudden load. Fixed by tuning maxPoolSize and adding retry logic.
3. Kubernetes Is Worth the Complexity
Yes, the learning curve is steep. But automatic pod scaling, rolling updates, and self-healing saved me countless hours during testing. When a pod crashed during the soak test, Kubernetes restarted it in 3 seconds. I didn't even notice until I checked the logs.
4. Observability Is Non-Negotiable
You cannot improve what you cannot measure. Prometheus + Grafana gave me confidence that the system was actually handling load, not just "seemed fine."
What's Next?
This project taught me that building distributed systems isn't about following trends, it's about making deliberate architectural choices and validating them ruthlessly.
Future improvements I'm considering:
- Distributed tracing with Jaeger to visualize request flows across services
- Circuit breakers using libraries like
opossumto handle cascading failures gracefully - Rate limiting at the ingress level to protect against DDoS
- Database read replicas to offload query traffic from primary nodes
Try It Yourself
The entire project is open source and documented. You can run it locally with:
# Install dependencies
brew install kubectl skaffold helm

# Set up secrets
kubectl create secret generic jwt-secret --from-literal=JWT_KEY=your_secret
kubectl create secret generic stripe-secret --from-literal=STRIPE_KEY=your_stripe_key

# Start all services
skaffold dev
Run a load test:
chmod +x perf-tests/oha/*.sh
bash perf-tests/oha/load-test-create-tickets.sh
The full source code, Kubernetes manifests, and performance test suite are on GitHub.
Building this taught me more about distributed systems than any book or tutorial ever could. If you're learning microservices, stop reading and start building. Then load test it until it breaks. You'll learn far more from the failures than the successes.